


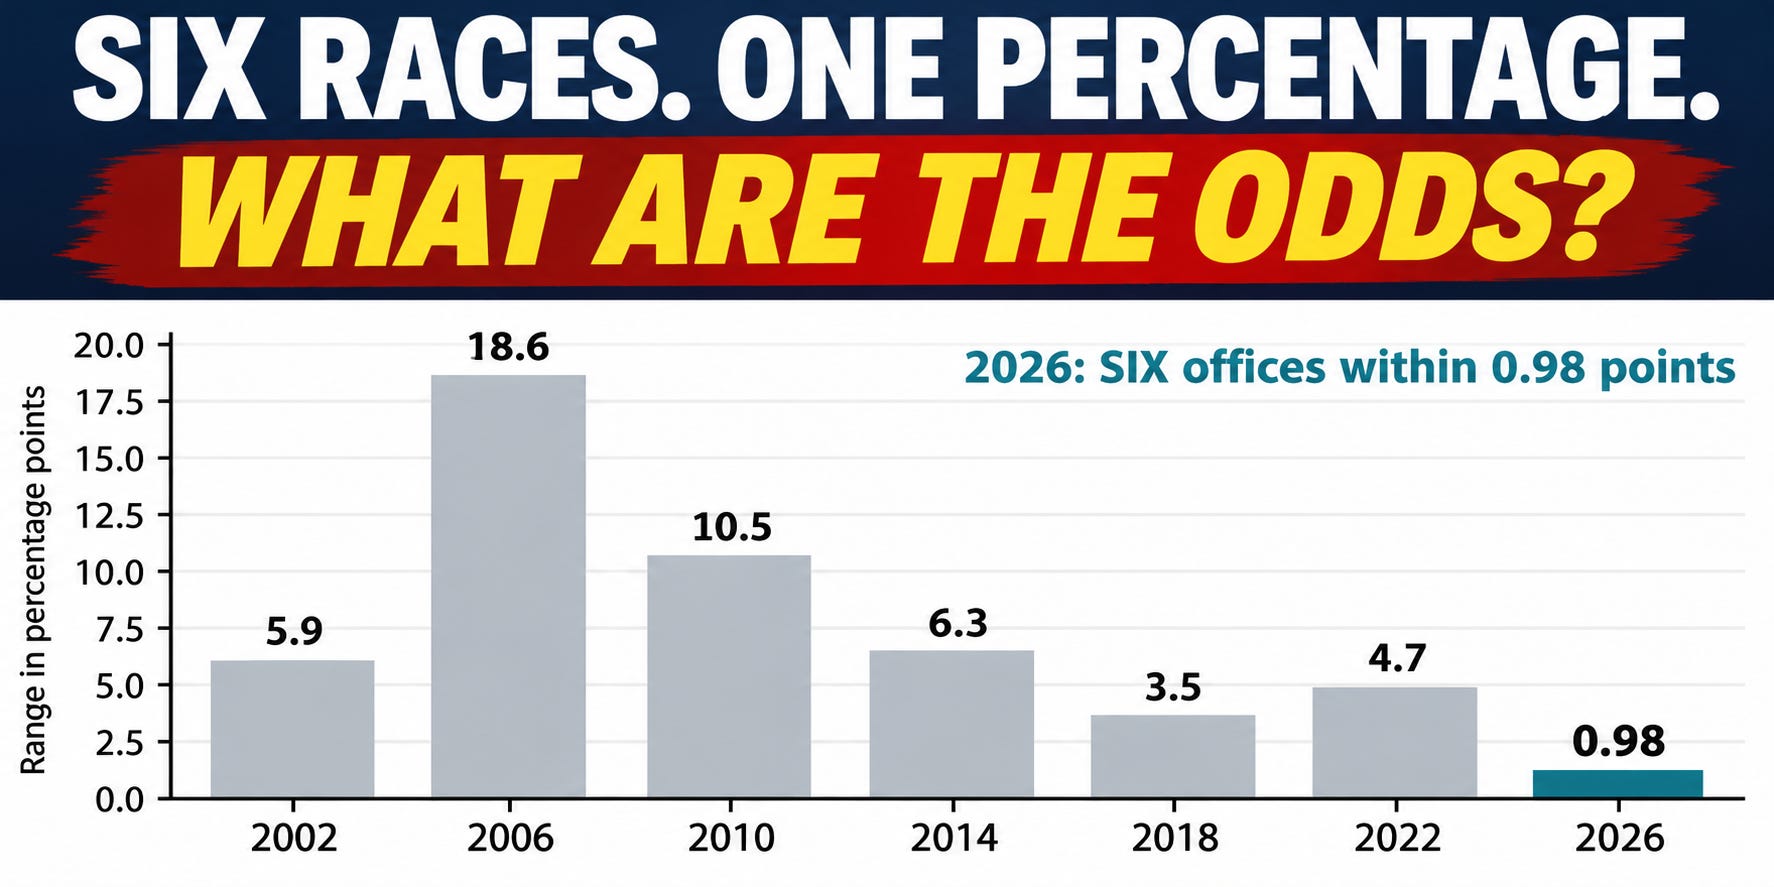
Six Races. One Number.
California’s 2026 results are an extraordinary statistical anomaly. The odds are 1 in 1,400. The state owes its voters an answer.
By Jim Reynolds | www.reynolds.com
November 7, 2026
California politicians must think we are all idiots.
Six statewide offices. Six different candidates. Six different opponents. Six different campaigns, with six different names, six different controversies, six different local dynamics.
And all six Democratic candidates landed within 0.98 percentage points of one another.
Not when rounded to whole numbers. Calculated from the reported vote totals themselves: the narrowest result is 65.11%, the highest 66.09%. A spread of less than one point across six separate statewide races that have never, in 24 years of comparable elections, come within 3.5 points of one another.
This is not a coincidence. This is a pattern demanding an explanation — and the burden of proof now rests on the state to provide one.
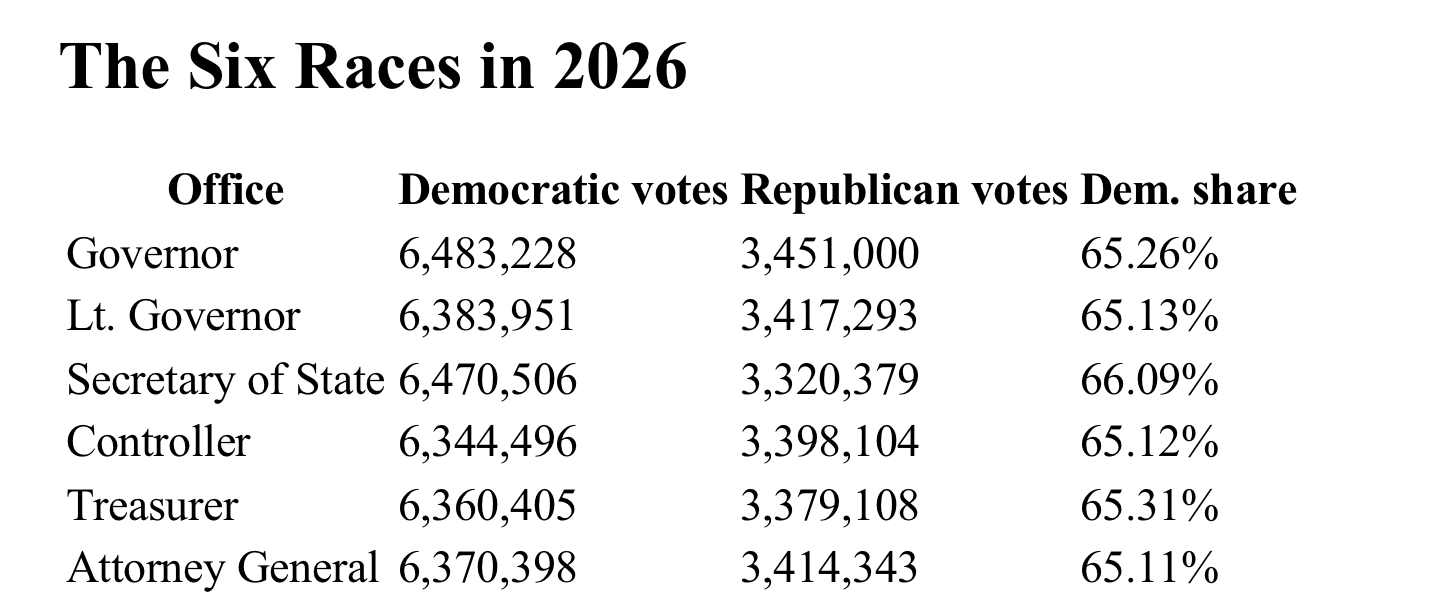
Six different races. Six different candidates. Six different opponents. And six results compressed into a band of less than one point.
The raw vote totals differ by candidate — hundreds of thousands of votes separate the highest and lowest Democratic totals. Yet the percentages converge to within a single point. The pattern is consistent with coordinated adjustment, and the state must show it isn’t.
The Historical Record: This Has Never Happened Before
To compare like with like, every percentage below is the Democratic share of votes cast for the Democratic and Republican candidates. Third-party votes are excluded.
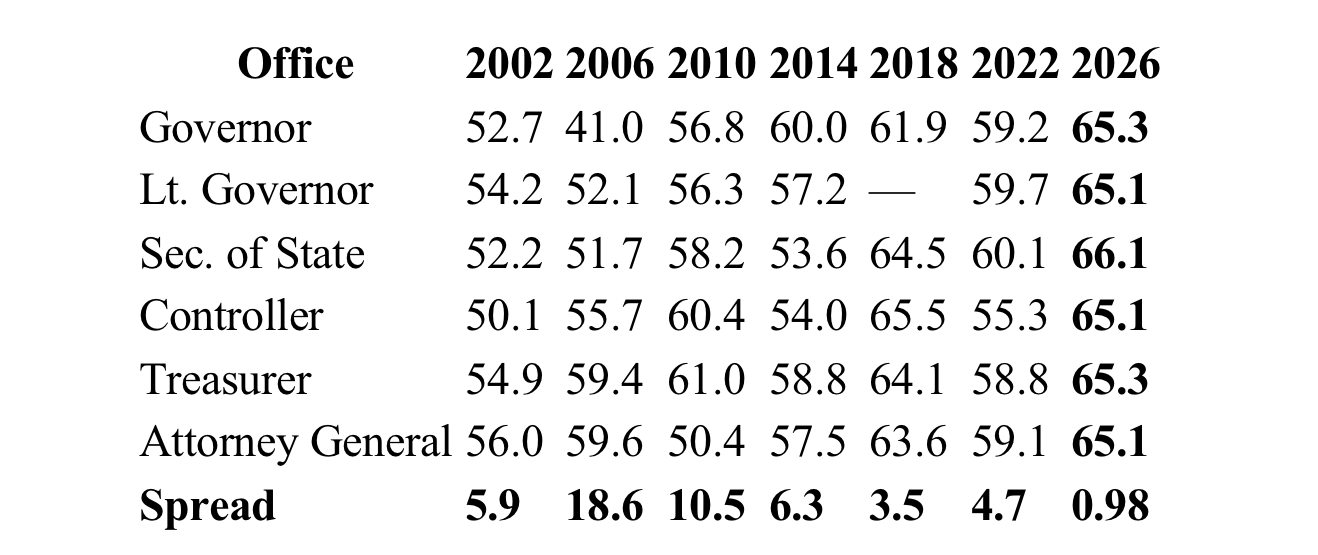
Six elections. Twenty-four years. The spread between the highest and lowest Democratic candidate has never been below 3.5 points.
In 2006, the spread was 18.6 points — largely because Arnold Schwarzenegger won reelection as a Republican governor while Democrats swept the rest. That’s what real elections look like: candidates rise and fall on their own merits. In 2010, it was 10.5 points. In 2014, 6.3. In 2022, 4.7.
The median spread across the previous six elections: 6.1 points.
The 2026 spread: 0.98 points. One-sixth as large as the historical norm. Smaller than anything in a quarter-century of data — by a factor of 3.5. That means that they were out of whack by 350%.
Visualizing the Anomaly
Here’s what 24 years of real elections look like:
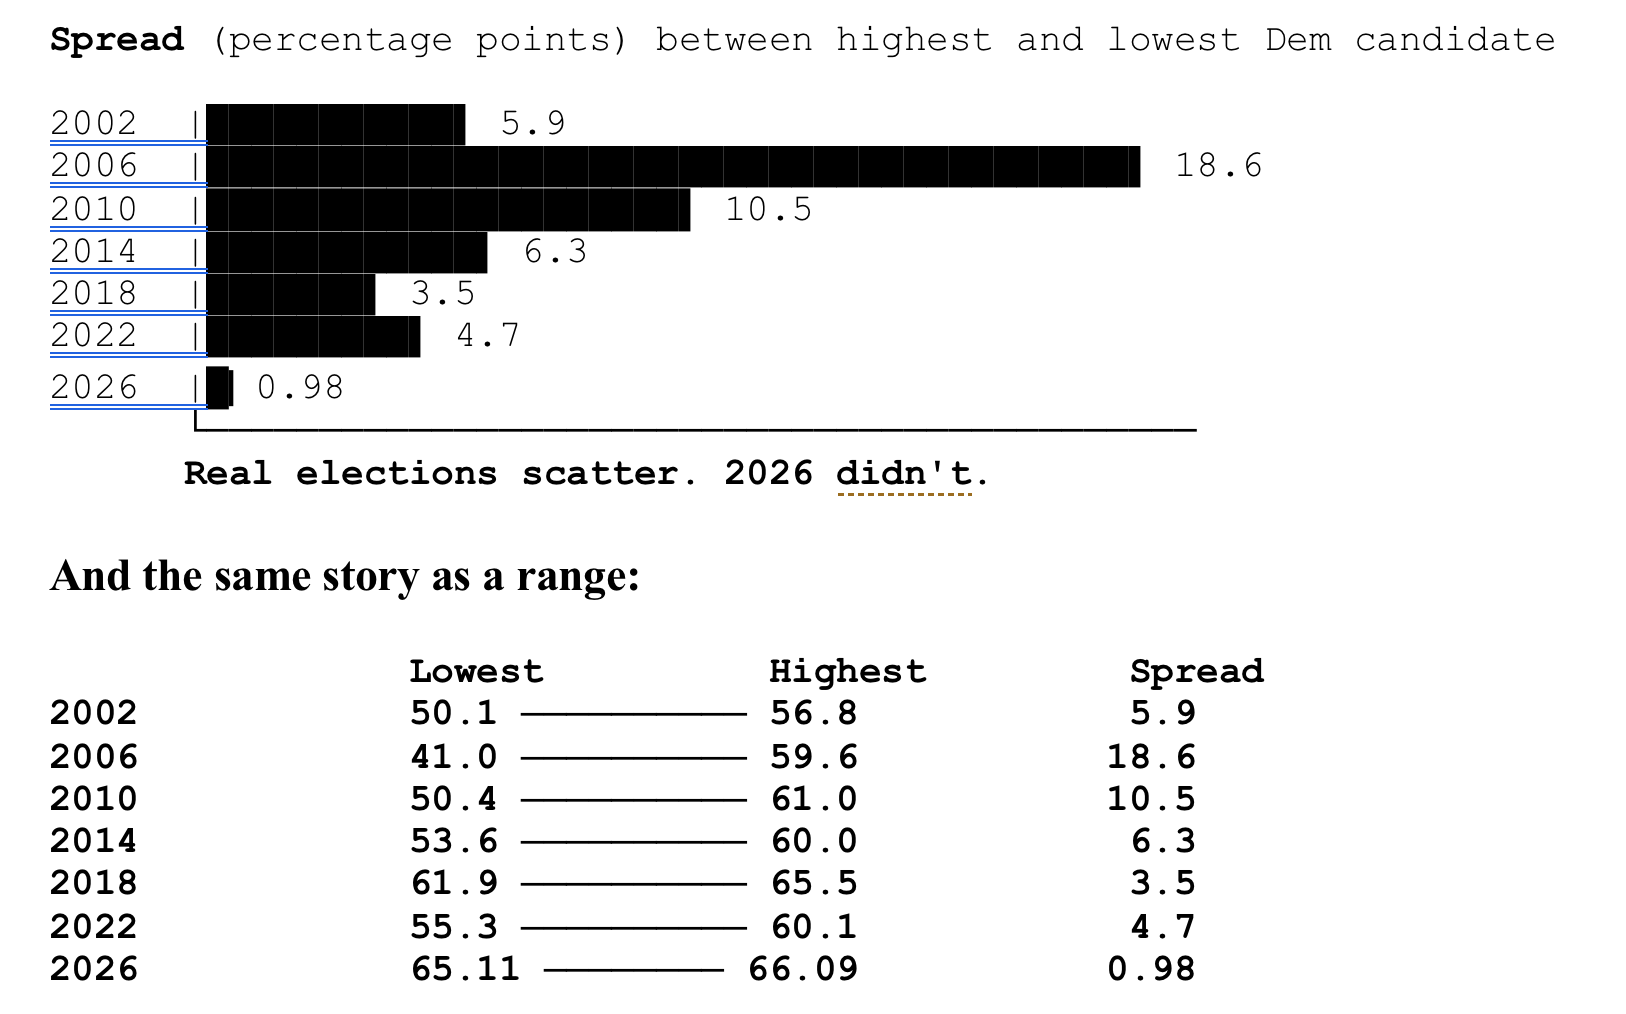
Every previous election, the candidates scattered. 2026 didn’t scatter — it snapped into alignment.
The Raw Numbers Tell the Same Story
Percentages can disguise differences in turnout. Here are the raw counts for the last two elections:
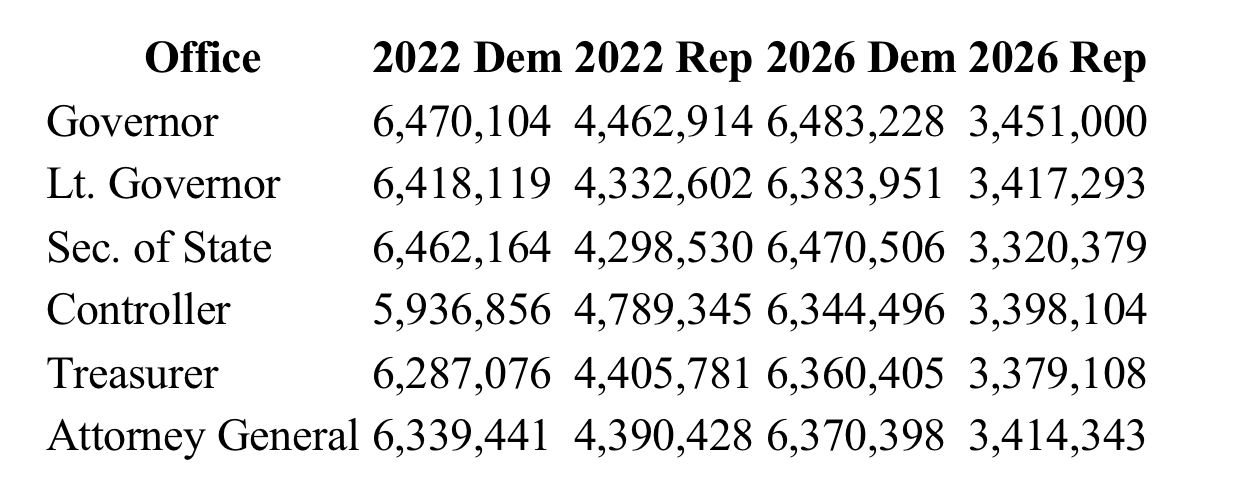
In 2022, the highest and lowest Democratic vote totals were separated by 533,248 votes. In 2026, that range collapsed to 138,732 — a drop of nearly 75%.
For Republicans: 490,815 votes of spread in 2022, collapsing to 130,621 in 2026.
So what happened to the normal vote spread for Republicans?
And by the way, the 2026 Republican adversary was not your normal mail-it-in and forgotten political foe. It was Steve Hilton, a very visible candidate with national exposure. Yet he produced nary a blip in the vote totals?
Candidate vote-total variation in 2022 was 3.8 times larger than in 2026.
One might argue 2022 was itself an unusual year — five of its six Democratic candidates finished within 1.26 points of one another, with the controller’s race as the outlier (Republican Lanhee Chen drew crossover support, and Democrat Malia Cohen won only 55.35%).
But that argument cuts the wrong way. 2022 still produced an outlier. Real elections always produce outliers — a scandal here, a name-recognition advantage there, a crossover phenomenon somewhere else. The 2026 result doesn’t have an outlier.
It doesn’t have any variation at all.
The Odds
Here’s the question: how often would six genuinely distinct contests — six candidates, six campaigns, six sets of local dynamics — land within 0.98 points of one another?
We can measure how much statewide Democratic candidates typically deviate from their year’s average. Using the three most recent comparable elections (2014, 2018, 2022), the candidate-to-candidate standard deviation is approximately 1.96 percentage points.
Model six candidate results drawn from a bell-shaped distribution with that level of variation. The probability that all six fall within a band no wider than 0.98 points:
Approximately 1 in 1,400.
Under the stated model. That’s what the number means, and that’s the only qualifier it needs.
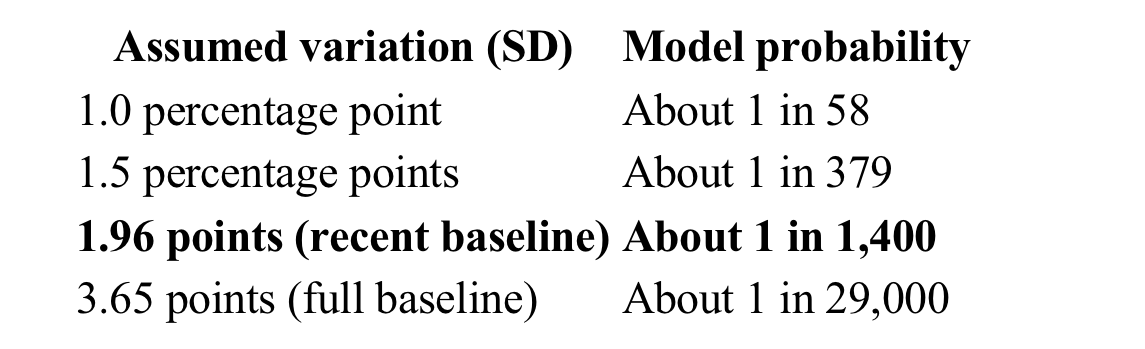
Let’s be clear about what this number does and doesn’t mean.
It does not prove fraud beyond a reasonable doubt. But the standard objections don’t survive contact with the data.
The “straight-ticket voting” objection: voters who straight-ticket vote produce correlated outcomes — races moving in the same direction. They do not produce identical percentages. Correlated voting explains why six races all leaned Democratic. It does not explain why six separate contests — with six different candidates, six different opponents, six different campaign dynamics — landed within a single point of one another. If the electorate were so monolithic that all six races converged to within 0.98 points, then 2022’s outlier (Chen’s crossover) should never have existed. But it did. Real elections scatter. That’s what 24 years of data show.
The “same voters, so not independent” objection: true, and irrelevant. The same electorate participates in every election — which is precisely why the historical spread has never been below 3.5 points. The correlation was already present in every one of the six prior elections. It never produced a 0.98-point spread. Something changed in 2026 that isn’t explained by voter behavior alone.
The most parsimonious explanation for six distinct races converging to within one point is that the races were not, in fact, distinct — that the results were produced by a single process, not six.
The Question California Must Answer
The reported 2026 pattern is real, historically unprecedented, and statistically anomalous. It is not explained by the normal variation that has characterized every California election for a quarter-century.
Why did six different statewide contests produce an unusually tight convergence — and does that convergence remain unusual when we account for how Californians actually vote?
The county-level data is already public. The state should not merely publish raw returns and call it transparency. It should publish a precinct-by-precinct analysis explaining the convergence — an account of why six independent contests produced nearly identical results, not a spreadsheet and a shrug.
The count is currently 72% complete. The state certifies on December 11. There is time to do this properly — if the state chooses to.
This is not an accusation. It is arithmetic.
Six offices. Less than one percentage point. Twenty-four years of comparisons. One chance in 1,400.
That is a question California owes its voters.
Sources: California Secretary of State certified Statements of Vote for 2002, 2006, 2010, 2014, 2018, and 2022; California unofficial returns reported November 6, 2026. All probability estimates are conditional on the stated statistical model. Full graphical comparisons and source links available at reynolds.com.