


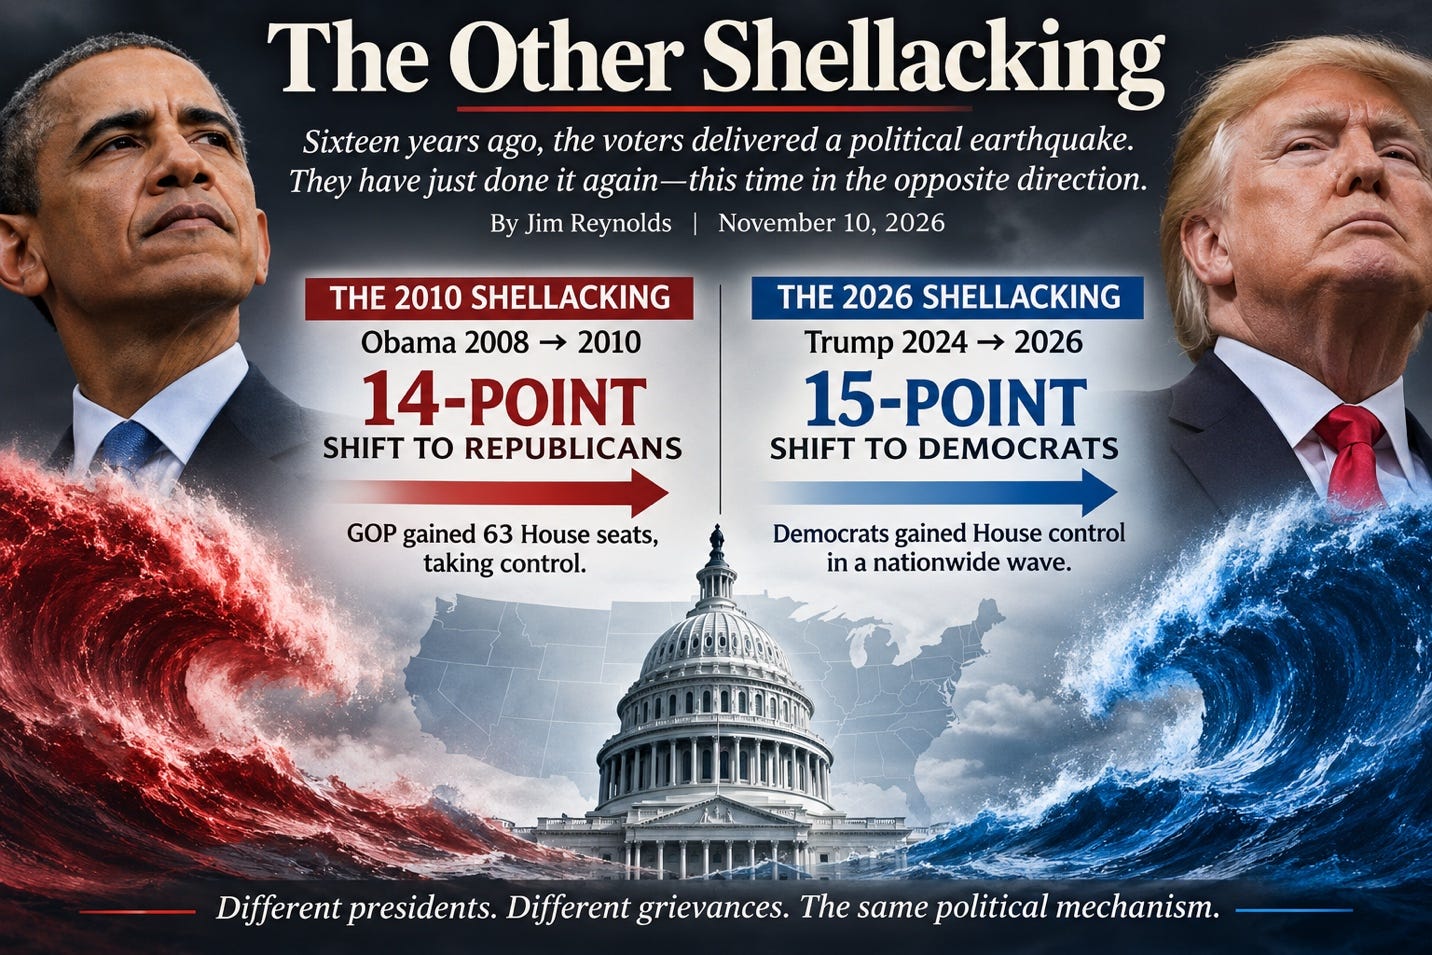
The Other Shellacking
Sixteen years ago, the voters delivered a political earthquake. They have just done it again—this time in the opposite direction.
By Jim Reynolds | www.reynolds.com
November 10, 2026
Something extraordinary happened in the November 2026 election. Democrats won across the country, including places where Republicans had seemed securely entrenched. The results were so widespread and so consistently favorable to Democrats that some observers began questioning whether they could possibly have occurred naturally.
It is a reasonable question to investigate. But before concluding that we have witnessed something unprecedented, we ought to examine an election that produced a remarkably similar result.
November 2, 2010.
That was the day American voters handed President Barack Obama what he himself called a shellacking.
And when we compare that election with the one that just occurred, we discover something fascinating.
The two elections look remarkably alike, except that the political parties have traded places.
Obama’s Shellacking
Barack Obama entered the White House in January 2009 riding a wave of enthusiasm. He had defeated John McCain by more than seven percentage points in the popular vote, carried 365 electoral votes, and brought substantial Democratic majorities into Congress.
His campaign had promised hope and change. Americans were ready for something different.
Two years later, they delivered something different indeed.
Republicans gained 63 seats in the House of Representatives, taking control of the chamber. Democrats lost seats across the country, including districts that had supported Obama enthusiastically just two years earlier.
What happened?
The country was still struggling to emerge from the Great Recession. Unemployment remained painfully high, the economic stimulus had failed to deliver the recovery many expected, and the Affordable Care Act had become a political lightning rod. Meanwhile, the Tea Party movement had mobilized conservative voters who believed Washington had moved too far, too fast.
Obama’s supporters hadn’t necessarily become Republicans. Many simply stayed home. Others turned against Democratic candidates. Republican voters, meanwhile, were highly motivated to participate.
The combined effect was devastating.
But just how devastating?
Two Elections, Opposite Directions
We compared the 2008 presidential election with the 2010 congressional election, then repeated the exercise using the 2024 presidential election and the 2026 congressional election.
In each case, we measured the change in the margin between Democratic and Republican votes. That lets us compare elections with different turnout levels and populations.
Here is what we found:

The movements are almost identical in magnitude.
One went right. The other went left.
In 2010, the Republican share of the national House vote exceeded the Democratic share by approximately 6.6 percentage points. In 2026, preliminary results show Democrats leading Republicans by approximately 13.2 points.
Different starting positions, different political circumstances, and different winners. But the movement away from the president’s party was remarkably similar.
In both elections, the House changed hands.
The State-by-State Evidence
The national results are striking enough. But what happened inside individual states?
We applied the same comparison to the states, measuring the change between the presidential election and the combined House vote two years later.
Here are seven examples:
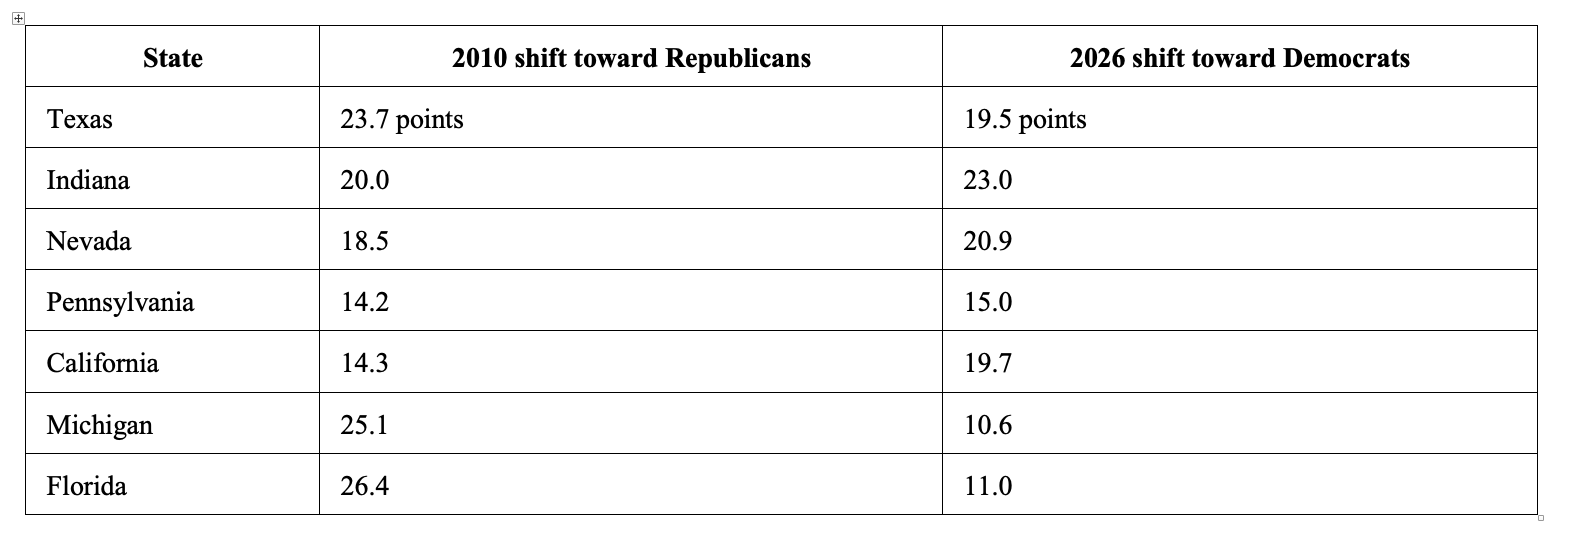
These are two-party margin changes, not changes in one party’s vote share. The 2026 figures are preliminary, and uncontested House races can distort some statewide comparisons.
Consider Texas. In 2010, the state shifted almost 24 points toward Republicans compared with Obama’s presidential election. In 2026, it shifted about 20 points toward Democrats compared with Trump’s.
In Pennsylvania, the two elections produced almost identical shifts: 14.2 points toward Republicans in 2010 and 15.0 toward Democrats in 2026.
Florida and Michigan moved considerably more in 2010 than in 2026. California and Indiana showed the opposite pattern.
The movements were substantial, but they were not uniform.
This phenomenon was not confined to a handful of battleground states.
In our comparison, 45 of the 50 states shifted toward Republicans in 2010. In 2026, all 49 states with comparable two-party House totals shifted toward Democrats.
That is an unusually broad movement. It is also an important reminder that these elections can develop a nationwide character that overwhelms many local political differences.
How Does This Happen?
There is a temptation to think of the electorate as a relatively fixed collection of Republicans and Democrats who appear every two years and cast essentially the same votes.
It doesn’t seem to work that way.
Presidential elections attract voters who often fail to participate in midterms. Some voters change their minds about the party in power. Others are motivated to participate precisely because they are angry with the administration. And even voters who remain loyal to their party may be less enthusiastic about turning out.
These changes do not have to occur independently in every county.
National economic conditions affect millions of Americans simultaneously. A controversial government policy can create dissatisfaction across state lines. A president’s popularity, or lack of it, can influence congressional races hundreds of miles apart.
In 2010, the struggling economy, health care legislation, and dissatisfaction with Washington created a favorable environment for Republicans.
In 2026, voter surveys identified widespread frustration over inflation and living costs, the Iran war, and concerns about the Trump administration’s priorities and conduct. Democrats benefited from voters who wanted Congress to act as a stronger check on the president.
The particular grievances were different. The political mechanism was much the same.
When enough voters become dissatisfied with the party in power, the consequences can spread throughout the country.
The Mathematics of a Political Wave
This brings us to the statistical patterns that have attracted attention since the recent election.
Some analysts have observed that Republican candidates in many counties received a remarkably consistent percentage of Trump’s 2024 support. They have suggested that such consistency could indicate that election totals were generated using a common mathematical formula.
There is another possibility.
The electorate may have been responding to broadly similar national conditions.
Suppose Republicans lose support across much of the country because their voters are less enthusiastic, some independent voters shift toward Democrats, and previously inactive Democratic voters turn out. The resulting election returns will often show a consistent relationship with the previous presidential vote.
That relationship can be described mathematically. It can even be used to predict results with reasonable accuracy.
But a formula that describes an outcome is not necessarily a formula that produced it.
The 2010 election illustrates the distinction. A national political wave produced large Republican gains across most of the country. We can measure those movements, compare the states, and calculate their statistical relationships. None of that requires a centrally coordinated election operation.
The same reasoning applies to 2026.
This does not prove that every reported vote was legitimate. Historical comparisons cannot establish that. But neither does an unusually consistent nationwide movement establish that votes were manipulated.
To answer that question, we need evidence about the actual voting and counting processes, not merely an unexpected electoral pattern.
What History Tells Us
We have examined the November 2026 election from several directions: turnout, registration growth, geography, demographics, and now historical precedent.
The results remain remarkable. A Democratic shift of roughly 15 points in the national two-party margin is an enormous political movement. The fact that nearly every state moved in the same direction makes it even more striking.
But 2010 demonstrates that a movement of comparable magnitude has happened before.
It happened when the voters became deeply dissatisfied with a Democratic president and his administration. Sixteen years later, it happened when voters became deeply dissatisfied with a Republican president and his administration.
Neither election was normal. Both occurred under unusual political circumstances, when several powerful forces converged at precisely the right moment.
There is an important lesson here for anyone examining surprising election results. Statistical anomalies deserve investigation, but history provides the context needed to understand them.
Sometimes extraordinary numbers reveal something improper.
Sometimes they reveal something extraordinary about the electorate.
And sometimes the most surprising discovery is that what seemed unprecedented has happened before.
In 2010, the voters gave Obama a shellacking. In 2026, they gave Trump one. The direction changed. The power of the electorate did not.

The shifting and why will always support questions. What follows should answer if it is even worth a guess?