


What We Found in Texas
A remarkable 2026 election, examined through the votes, registrations, geography and turnout.
By Jim Reynolds | www.reynolds.com
November 10, 2026
Note: Like many of my readers, I approached the Texas results skeptically. A swing of this size, concentrated in urban and border counties and accompanied by rapid registration growth, raised obvious questions. I dug into the available numbers looking for patterns that might indicate something beyond ordinary turnout and demographic change. Here is what the data show — and what they still do not establish.

Texas gave us an election worth examining. In 2022, Greg Abbott won another term as governor by nearly 884,000 votes. Four years later, Democrat Gina Hinojosa defeated him by about 706,000. That is a swing of roughly 1.59 million votes in the two-candidate margin. Rather than begin with an explanation and work backward, we examined what the numbers themselves tell us.
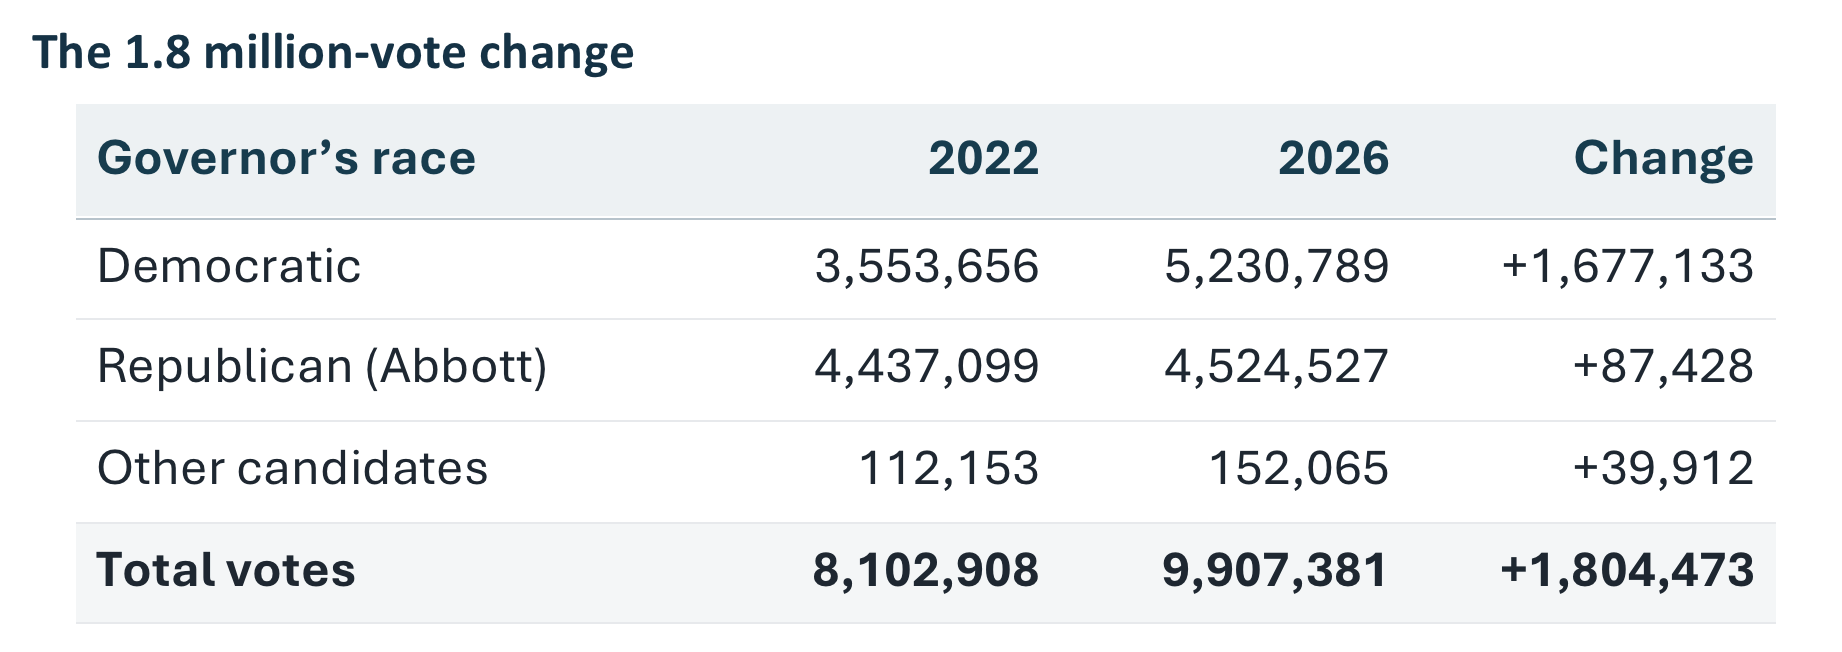
Democratic votes rose 47%, while Abbott’s total increased only about 2%. The state also had more registered voters: 17.67 million in 2022 and 19.04 million in 2026, a net increase of 1.37 million, or 7.7%. Yet votes cast in the governor’s race rose 22.3%. A larger electorate explains some of the increase; greater participation explains more. Measured against registered voters, participation in the gubernatorial contest rose from about 45.9% to 52.0%. Texas had reached a similar statewide turnout rate in the 2018 midterm, so 2026 was not unprecedented in participation rate.
Where the Democratic votes increased
We divided the state into four non-overlapping geographic groups, so no county gets counted twice. The five largest urban counties account for almost half the statewide Democratic vote gain. The 16-county border group experienced a smaller numerical increase but a sharper shift in Democratic vote share.
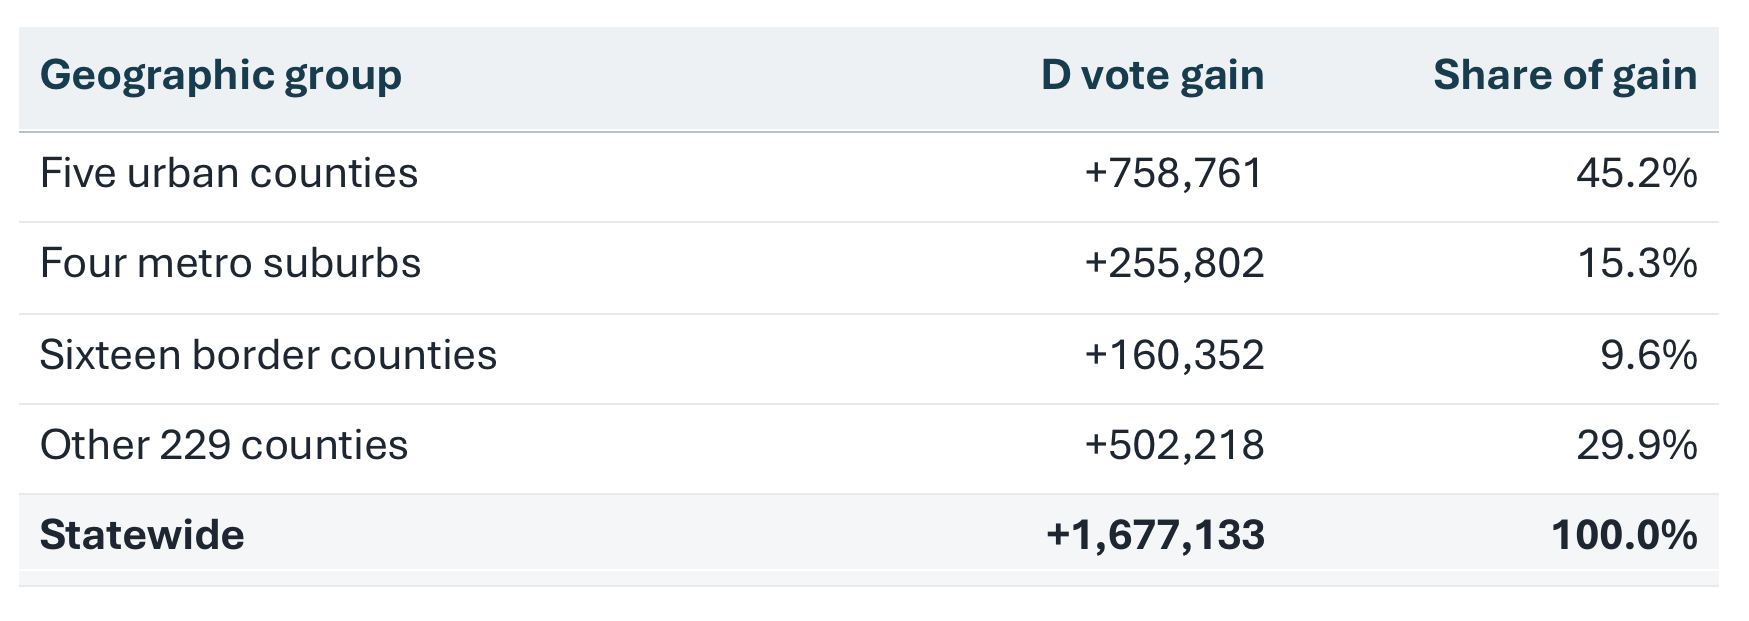
Harris County alone contributed 283,481 additional Democratic votes. Dallas, Tarrant, Bexar and Travis also posted large increases. In the border group, Hidalgo, El Paso, Cameron and Webb together contributed 149,612 additional Democratic votes—more than 93% of the border group’s gain. The border group’s Democratic share of the governor vote rose approximately ten percentage points.
Registration Growth Was Uneven
Of Texas’s 254 counties, 199 gained registered voters between 2022 and 2026, while 55 lost them. Some of the fastest growth occurred in the suburbs and communities surrounding major cities. Kaufman County increased 27.5%, Hays 21.3%, and Montgomery 18.9%. Housing availability, construction, and population movement may help explain why these communities are growing faster than established urban centers.
We wanted to know whether counties gaining registered voters were also gaining Democratic votes. To investigate, we used the Pearson correlation coefficient, a statistical measure of how closely two sets of numbers move together.
We examined 25 urban, suburban, and border counties. The relationship was strong: a Pearson correlation of +0.80. Counties adding the most registered voters generally also experienced the largest increases in Democratic votes.
There is an important qualification. Larger and faster-growing counties naturally tend to add more voters of all political persuasions. The correlation reveals a strong numerical relationship, but it does not tell us how the newly registered voters actually voted.
What we learned about the voters
Tarrant County supplies an especially useful piece of voter-history evidence: 142,399 people who voted in 2026 had registered in that county after the 2022 election. This is not the same thing as 142,399 first-time Texas voters. Some may have moved from other counties or states; others may have been eligible but previously unregistered. The county also reported that the median age of registrants in the year preceding the 2026 election was 29, compared with 35 in the equivalent period preceding 2022.
Early voting itself became more important: about 68% of governor votes were cast early in 2022, compared with roughly 78% in 2026. An early-voter study also identified 1.81 million people who had not voted in either the 2018 or 2022 midterm elections. That does not mean they were newly registered voters. Many had voted in presidential elections or primaries. It tells us that a substantial number of people who had skipped previous midterms participated this time.
What the numbers do not establish
Texas generally allows applicants to register to vote by attesting that they are U.S. citizens. To “attest” means to declare something to be true. It does not require presenting documentary proof that the statement is true. At the polling place, a driver’s license or other approved identification ordinarily establishes identity, not citizenship. Texas has additional citizenship-verification procedures, but routinely requiring documentary proof from every applicant is not one of them. This is an important distinction in election law. Nevertheless, none of the registration and turnout figures we have examined establishes how many noncitizens, if any, voted in 2026, or whether such voting affected the result.
Nor can a county’s Democratic vote gain be assigned to its newest registrants. Secret ballots prevent that individual match. We can compare registrations, turnout and candidate totals; we cannot infer a voter’s candidate choice or immigration history from age, sex, geography or the timing of registration.
Where this leaves us
We began with a question: Where did 1.8 million additional votes come from? We now know much more about where they were cast and how turnout changed. We still lack a complete, matched statewide breakdown of new registrants, returning voters and people who moved between counties. Those records are the next step. For now, the responsible conclusion is straightforward: this was an extraordinary political reversal, but the material examined so far does not establish fraudulent voting as its cause.
An extraordinary election deserves an extraordinary examination. We have learned a great deal about what happened in Texas. We have not yet learned everything about why.

Thanks for this analysis Jim. Detailed and "just the facts Ma'am" (Joe Friday would be proud).